ARCHIVED STORY
Visualizing FireEye Endpoint Security Host Management Data With Google Data Studio
By Ryan Delany · July 07, 2021
The Host Management module for FireEye Endpoint Security expands upon existing alert, triage, containment, and acquisition capabilities by allowing users to assess and report on their environment at scale. With the Host Management module, users can quickly and easily distinguish between physical, virtual and cloud hosts, as well as view the real-time status of agent components, identify every operating system in their environment, identify every device a user is logged in to, and more. More details on the Host Management module can be found in the following video.
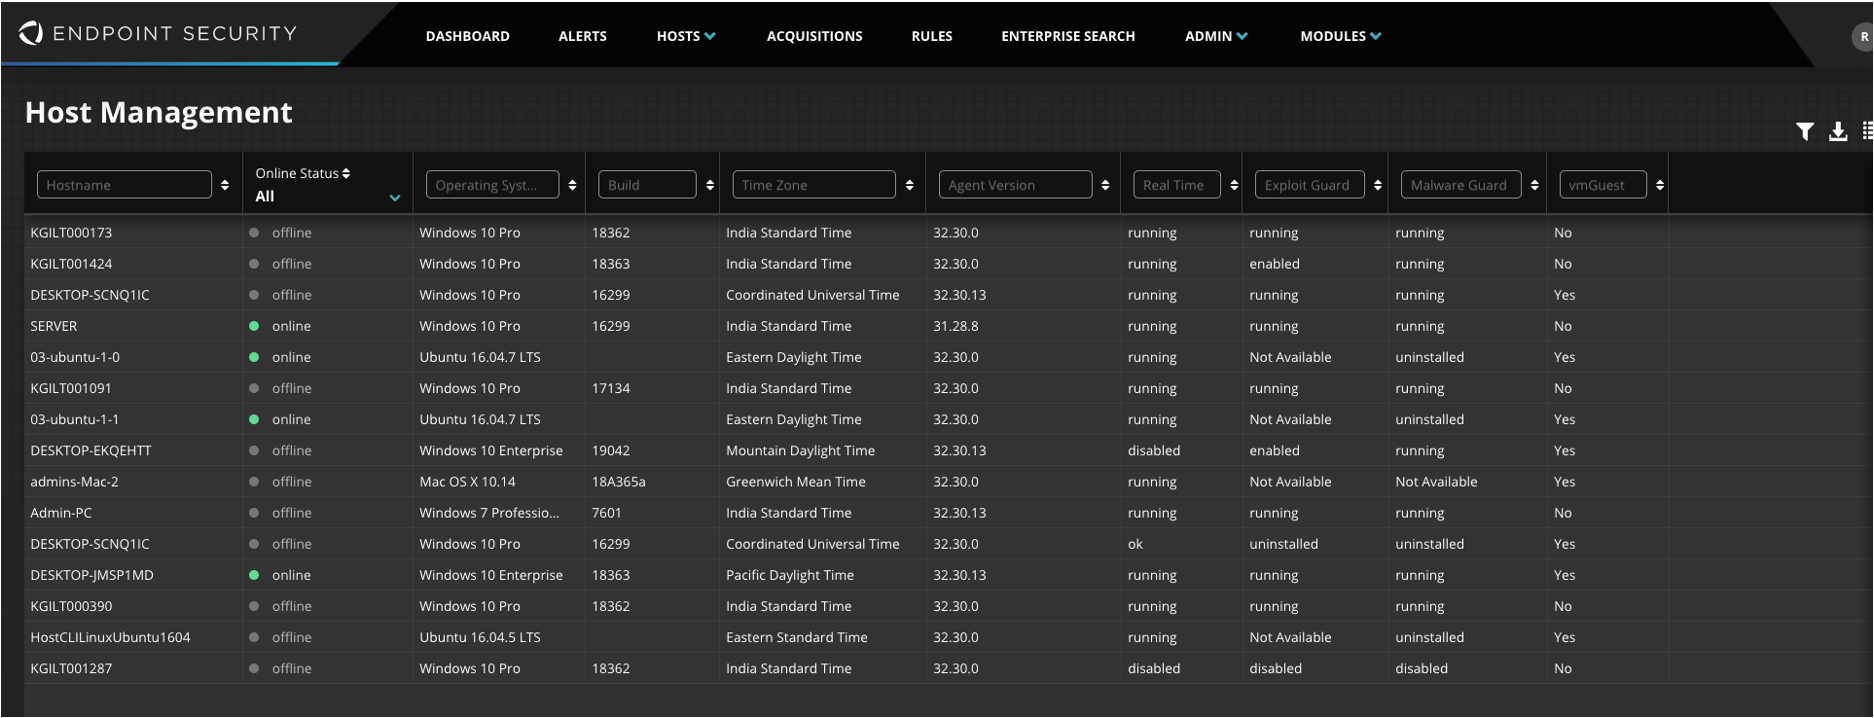
The Host Management module includes a user interface component embedded within the FireEye Endpoint Security dashboard that displays all the information in a customizable, interactive way, as depicted in Figure 1. The Host Management module allows users to select relevant fields to display, filter the data, and sort the results to provide insight into the environment.

Figure 1: Host Management module user interface
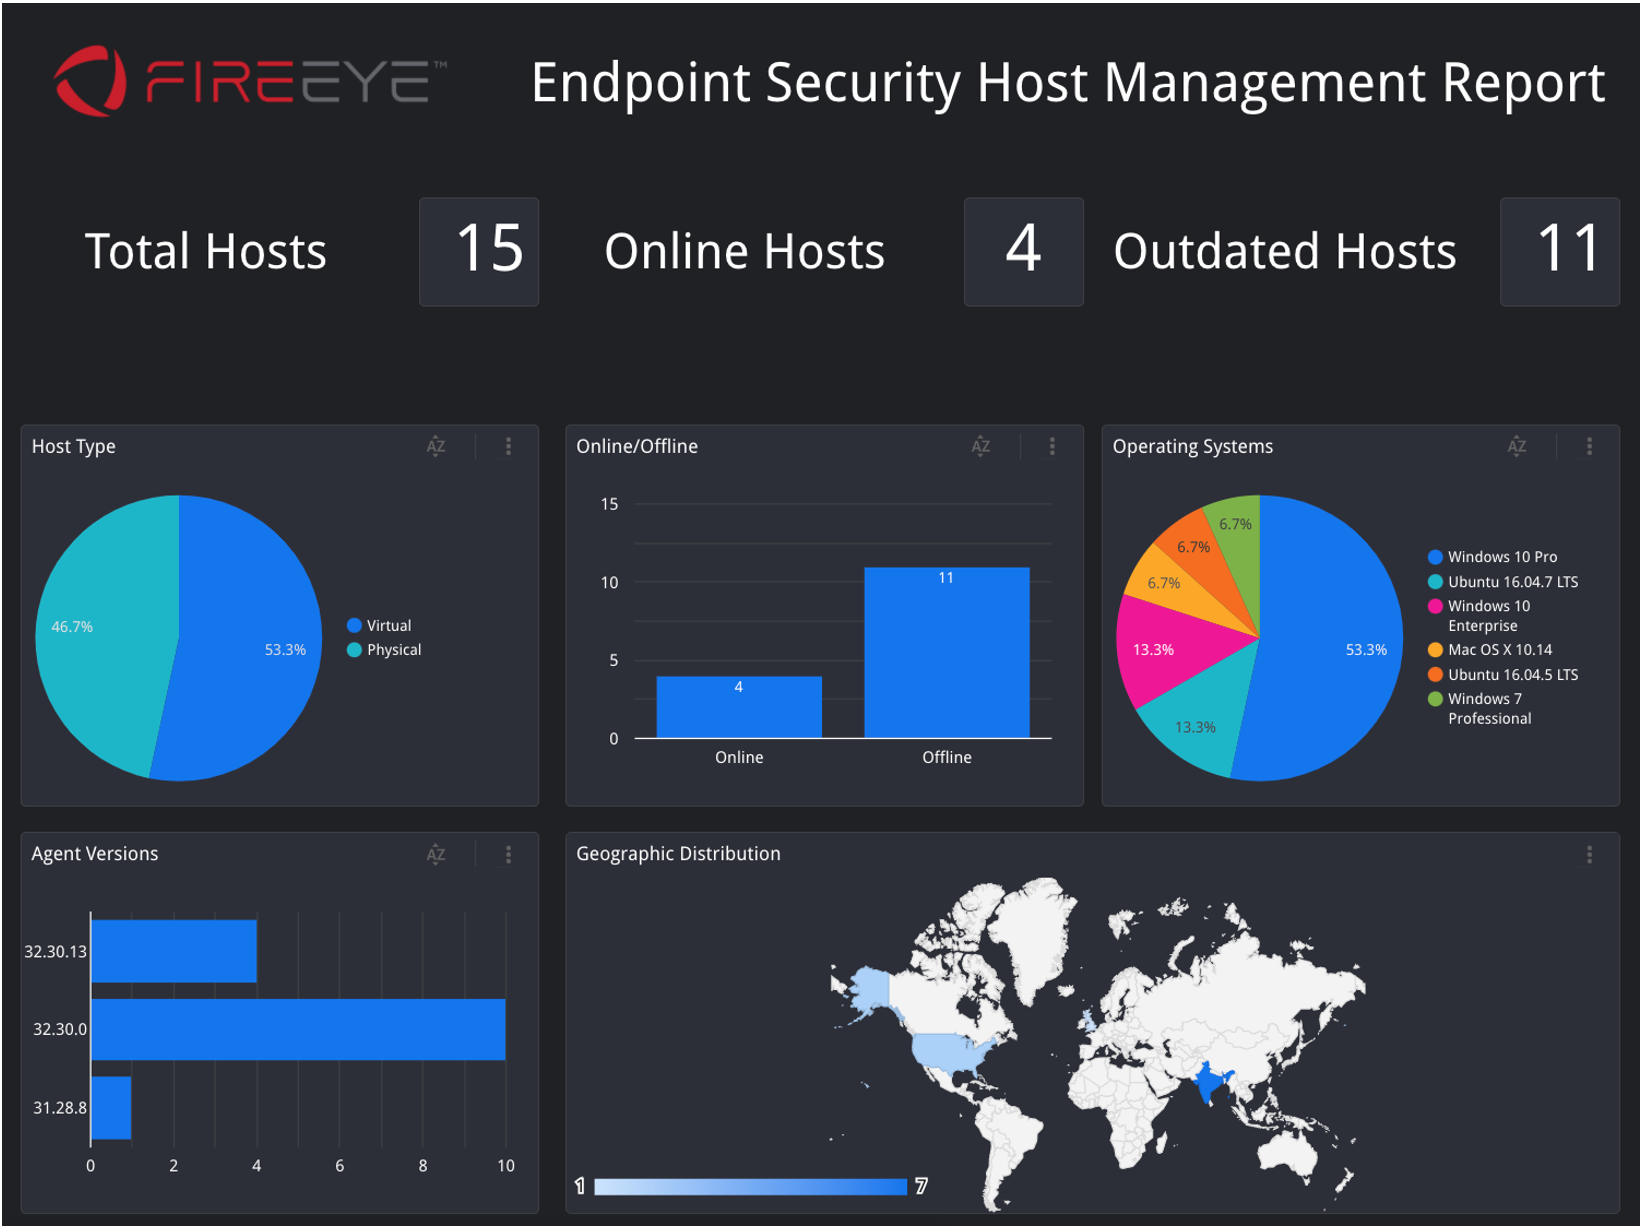
Additionally, this data can be downloaded as a CSV file for offline processing via tools such as Microsoft PowerBI, Tableau or Google Data Studio. Using one of these third-party tools enables users to build customized visualizations according to their own business requirements, as shown in Figure 2.

Figure 2: Sample Data Visualization Dashboard
Downloading and importing CSV files for processing manually is an inefficient and laborious process, but don’t worry, we’ve got it covered.
APIs To the Rescue
FireEye Endpoint Security has an application programming interface (API) that enables customers to programmatically interact with the product to eliminate manual efforts such as manually downloading and processing CSV files. Using this API, there are endless integration possibilities.
For the remainder of this post, I’ll share the details of a sample project I’ve created that leverages a custom built connector for Google Data Studio using the FireEye Endpoint Security Host Management module API.
What is Google Data Studio?
Google Data Studio is a free drag and drop report editor provided by Google that allows users to create completely customized visualizations of data. Data Studio provides a broad set of chart types to help structure a report and is capable of using data from hundreds of sources. Google provides 19 connectors to many Google services, including Google Sheets, Search Console, Google Analytics, YouTube, and others. Additionally, there are over 300 community connectors built by partners that anyone can use. Lastly, anyone can build their own connector if one doesn’t already exist. While this post focuses on integrating with Google Data Studio, this same concept can be leveraged with many other data visualization tools such as Microsoft PowerBI, Tableau, Domo and others.
Putting It All Together
There are three steps required in order to start building custom dashboards in Google Data Studio with the data from the FireEye Endpoint Security Host Management module API.
Step 1
First, prepare the FireEye Endpoint Security environment. In order to do this:
- Verify that version 5.02 or later of FireEye Endpoint Security is running
- Modify an existing user or create a new user in FireEye Endpoint Security and assign them either the api_admin or api_analyst role. For this example, the api_analyst role has adequate permissions.
- Install the following modules from the FireEye Market
- Host Management module
- API Documentation module (optional, but a useful reference)
Step 2
The second step involves building a connector or using this sample connector already built for this on GitHub. All the prerequisites and instructions for downloading and deploying the connector can be found on the project page. Using this connector, supply the URL and credentials for the FireEye Endpoint Security API instance and start building reports right away without any coding required.
If users prefer to build their own connector, Google has a great resource to get started. Also refer to the following FireEye resources, which contain detailed information about the API:
- FireEye Developer Hub
- Endpoint API Documentation (login required)
- Host Management Module Documentation (contains data field definitions)
Step 3
The last step is to build reports! To help get folks started, I’ve created and shared this report template. Use this as a starting point or start building from scratch with the data now available. There are 65 data fields accessible via the Host Management API, so the possibilities are vast.
Summary
This post covers one example of leveraging the FireEye Endpoint Security API to build custom data visualizations specific to an organization’s needs and environment. This is not the only possibility however, and I would encourage users to explore similar integrations with a data visualization tool of choice—whether that is Microsoft PowerBI, Tableau, Domo, or something else.
At FireEye we are always excited to see how our products can be used and integrated with other tools, so if you do build something unique, be sure you share it with us in the FireEye Developer Hub Community.
RECENT NEWS
-
Jun 17, 2025
Trellix Accelerates Organizational Cyber Resilience with Deepened AWS Integrations
-
Jun 10, 2025
Trellix Finds Threat Intelligence Gap Calls for Proactive Cybersecurity Strategy Implementation
-
May 12, 2025
CRN Recognizes Trellix Partner Program with 2025 Women of the Channel List
-
Apr 29, 2025
Trellix Details Surge in Cyber Activity Targeting United States, Telecom
-
Apr 29, 2025
Trellix Advances Intelligent Data Security to Combat Insider Threats and Enable Compliance
RECENT STORIES
Get the latest
Stay up to date with the latest cybersecurity trends, best practices, security vulnerabilities, and so much more.
Zero spam. Unsubscribe at any time.